|
Summary: Structuring finances is key for the success of innovations in general and Telco 2.0 projects in particular. In this detailed extract from our new strategy report ‘A Practical Guide to Implementing Telco 2.0’, we describe the best ways to approach the management of revenues and costs of new business models, and how to get the CFO and finance department onside with the new approaches required (February 2013, Executive Briefing Service, Transformation Stream). |
|
Below is an extract from this 15 page Telco 2.0 Report that can be downloaded in full in PDF format by members of the Telco 2.0 Executive Briefing service and the Telco 2.0 Transformation Stream here. Non-members can subscribe here or other enquiries, please email / call +44 (0) 207 247 5003.
We'll also be discussing our findings at the New Digital Economics Brainstorms in Silicon Valley, 19-20 March, 2013 and in EMEA 2013 in London, June 5-6.
Cash Returns On Invested Capital (CROIC) is a good measure of company performance because it demonstrates how much cash investors get back on the money they deploy in a business. It removes measures that can be open to interpretation or manipulation such as earnings, depreciation or amortisation. In simple terms CROIC is calculated as:
While it is simplistic, STL Partners broadly sees the benefits of a Telco 2.0 Happy Pipe strategy accruing to a CSP in the form of higher EBITDA (Earnings Before Interest, Tax, Depreciation and Amortisation) margins (owing to lower costs) and lower capital expenditures. A Telco 2.0 Service Provider strategy will seek to also achieve this as well as generate sales growth. It is, therefore, easy to see why many operators are interested in pursuing a Telco 2.0 Service Provider strategy: if they can execute successfully then they will receive a double-whammy benefit on CROIC because lower opex and higher sales will result in more free cash flow being generated from lower levels of invested capital.
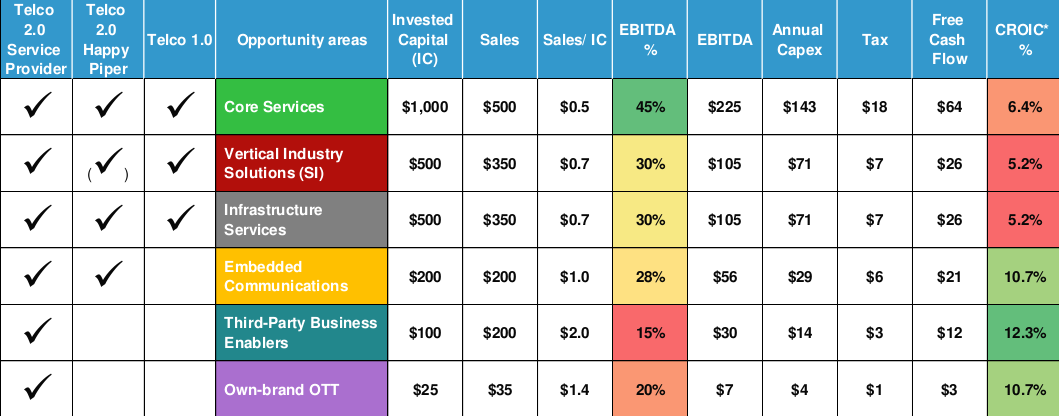
CROIC also demonstrates how the current financial metrics used by operators – particularly EBITDA margins – preclude operators from considering different operational and business models which may have lower EBITDA margins but higher overall cash returns on invested capital. Thus, as shown in Figure 2 (showing relative rather than actual financials), CSPs tend to focus on the existing capital-intensive business which currently generates CROIC of around 6% for most operators rather than investing in new business model areas which yield higher returns. The new business model areas require relatively low levels of incremental capital investment so, although they generate lower EBITDA margins than existing Telco 1.0 services, they can generate substantial CROIC margins and can ‘move the needle’ for operators.
Specifically, Figure 2 illustrates the way that different skills and operational models translate into different financial models by showing:
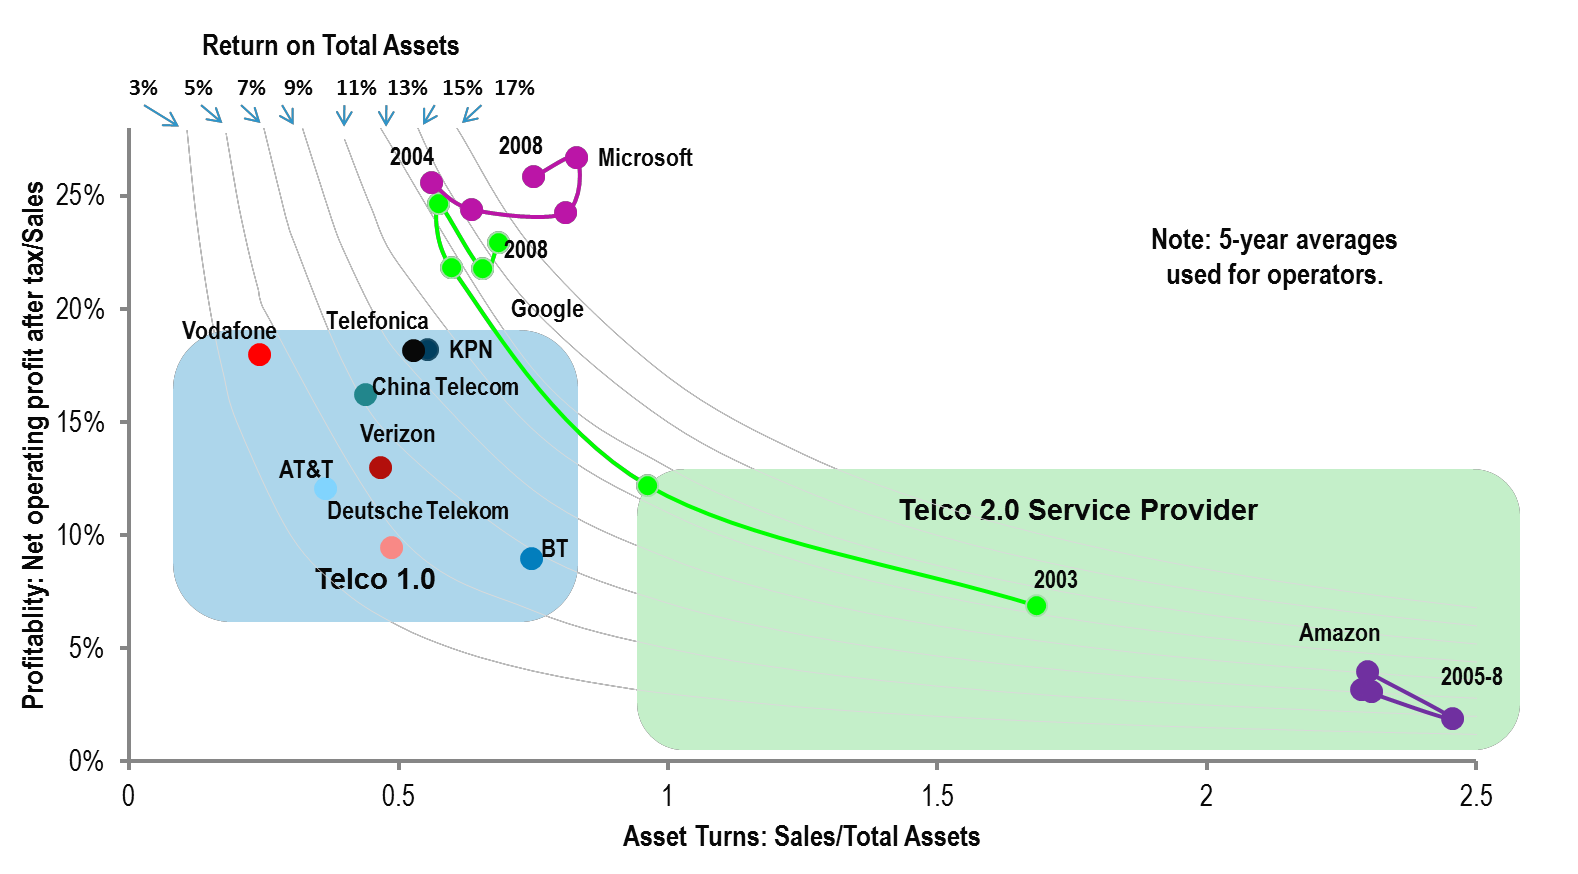
In essence, the new ‘product innovation’ businesses associated with being a Telco 2.0 Service Provider are much closer to an internet player such as Amazon or the early Google business (prior to heavy capital investment in fibre and data centres) in the way they make money. Not convinced? Look at Figure 3 which demonstrates the return on total assets generated by CSPs and three key internet players – Microsoft, Google and Amazon. Microsoft, a software business, generates high margins on a relatively low capital base (and hence generates very strong returns) owing to its dominant position on the desktop. Microsoft’s issue is growth not profitability, hence the big investments it is making in its internet business and in mobile. The young
Google and Amazon are classic product innovation businesses – low margin and high sales generation relative to invested capital. The CSP group all generate sales of $0.3-0.7 per $1 of capital but generate higher margins than Amazon and Google before 2005.
So we can see that the new Telco 2.0 business model makes money in a different way to the traditional business and needs to be managed and measured in a new way. Let’s explore the implications of this in more detail.
This table demonstrates the relative, rather than absolute, financial metrics for different CSP opportunity areas. The starting point is a nominal $1,000 of invested capital in the CSP network that results in $500 of annualised ‘Core Services’ revenues. Levels of invested capital, sales, EBITDA, annual capex, tax and free cash flow are then shown for each of the opportunity areas.

This chart shows how different businesses generate returns by plotting asset intensity (x-axis) against profitability (y-axis). Note that the profitability measure here (NOPAT margin) is not directly comparable to the EBITDA margin in Figure 2 as this is post-taxation.

The different types of revenue to be considered when developing a new Telco 2.0 service are outlined in detail in the A Practical Guide to Implementing Telco 2.0 in the section on the Telco 2.0 Service Development Process. These include different revenue types (such as single stream, multi-stream, interdependent), different revenue models (subscriptions, unit charges, advertising, licensing and commissions) and different sources (consumer, SME, enterprise as both end users and as third-party service providers – advertisers, merchants, etc.). It is clear that:
But what about how these new revenue types, models and sources impact the overall CSP business? How should (finance) managers now evaluate services given the different financial models between Telco 1.0 and Telco 2.0? What constitutes ‘attractive’ now? What metrics are the right ones to use? What trade-offs between the Telco 1.0 and Telco 2.0 revenue models need to be considered?
We lay out 5 revenue model guiding principles to help you address these knotty questions below:
1. Ensure your revenue model supports your overall strategy and need to build appropriate ecosystem control points.
In the Telco 1.0 world, the revenue model is simple and, although pricing is complex, decision- making is simplified by clear goals – to maximise the number of paying users and manage the price-volume trade-off (higher prices = lower volume of users or transactions) to maximise overall returns from communications services. The Telco 2.0 world is far more complex. As well as having ‘more revenue levers to pull’, management needs to consider the company’s overall digital strategy beyond communications.
CSPs need to consider where and how they will create one or more control points within the digital ecosystem. Revenue and pricing strategy is a core component of this. In some arenas – payments for example – CSPs may choose to price their services very low or make them free to build up a large number of mobile wallet users and a strong merchant network that can be monetised in another arena – mobile advertising perhaps. In other words, management cannot take a siloed approach to the CSP revenue model – there is a need to think horizontally across the CSP digital platform.
To read the note in full, including the following additional analysis...