Telco 2.0™ Research
The Future Of Telecoms And How To Get There
The Future Of Telecoms And How To Get There
| Summary: New figures released in Facebook’s S-1 filing for its IPO stack up with Telco 2.0’s previous analysis of Facebook’s performance for our report ‘Dealing with the Disruptors’. This further strengthens our views that many mooted valuations are overblown, and that Facebook will seek new sources of value in communications. (February 2012, Executive Briefing Service, Dealing with Disruption Stream). |
|
Below is an extract from this 23 page Telco 2.0 Report that can be downloaded in full in PDF format by members of the Telco 2.0 Executive Briefing service and the Telco 2.0 Dealing with Disruption Stream here. Non-members can subscribe here, buy a Single User license for this report online here for £595 (+VAT for UK buyers), or for multi-user licenses or other enquiries, please email / call +44 (0) 207 247 5003. We'll also be discussing our findings and more on Facebook at the Silicon Valley (27-28 March) and London (12-13 June) New Digital Economics Brainstorms.
To share this article easily, please click:The Facebook public share flotation is underway and as part of the process, it has published its first set of financial statements which detail financial trading and key performance indicators for the previous three years for their S-1 filing with the US Securities Exchange Commission (SEC)
The Telco 2.0 Team has recently analysed Facebook’s strategy and business model in our strategy report Dealing with the 'Disruptors': Google, Apple, Facebook, Microsoft/Skype and Amazon. Back in August 2011 we published a preview (Facebook: really 'worth' $30 billion max - $100 billion is hype), and we’ve now taken the opportunity to revisit our analysis in the light of the new data from Facebook’s S-1 filing.
Figure 1: STL Forecast vs. Actuals from Facebook S-1
|
2011 (figures in millions) |
Facebook S-1 |
Telco 2.0 forecast |
|
Users |
845 |
800 |
|
Revenue |
$3,711 |
$3,500 |
|
Free Cash Flow |
$470 |
$438 |
Facebook has a remarkable set of financials for a company so young.
Nonetheless, the Telco 2.0 Team stands by its original model and conclusions, which were that many mooted valuations of Facebook were too high given its current services and growth profile, and that the discrepancy would compel Facebook to expand into adjacent fields. The publication of the Facebook Initial Public Offering (IPO) affirms this belief. If Facebook attains anywhere near the expected valuation, they will have a share currency which will make expansion through mergers and acquisitions easier to achieve.
Our valuation of Facebook was US$30bn and we see no trading or key performance indicators in the S-1 filing which would make us alter our valuation. This compares to various reports which indicate a valuation for Facebook of US$100bn.
Our estimates (reviewed in this report) imply a p/e of 30 at launch, which would be consistent with Facebook being considered more of a growth stock than the Google of 2011, in an environment much less bullish than that of 2004.
Though as our friend Richard Kramer, MD of Arete financial research says, “tech stock valuations are frequently irrational”, so the market may well go crazy for Facebook at IPO. However, there has to be a point where reality bites, and the pressure on Facebook to find new revenues will be intense.
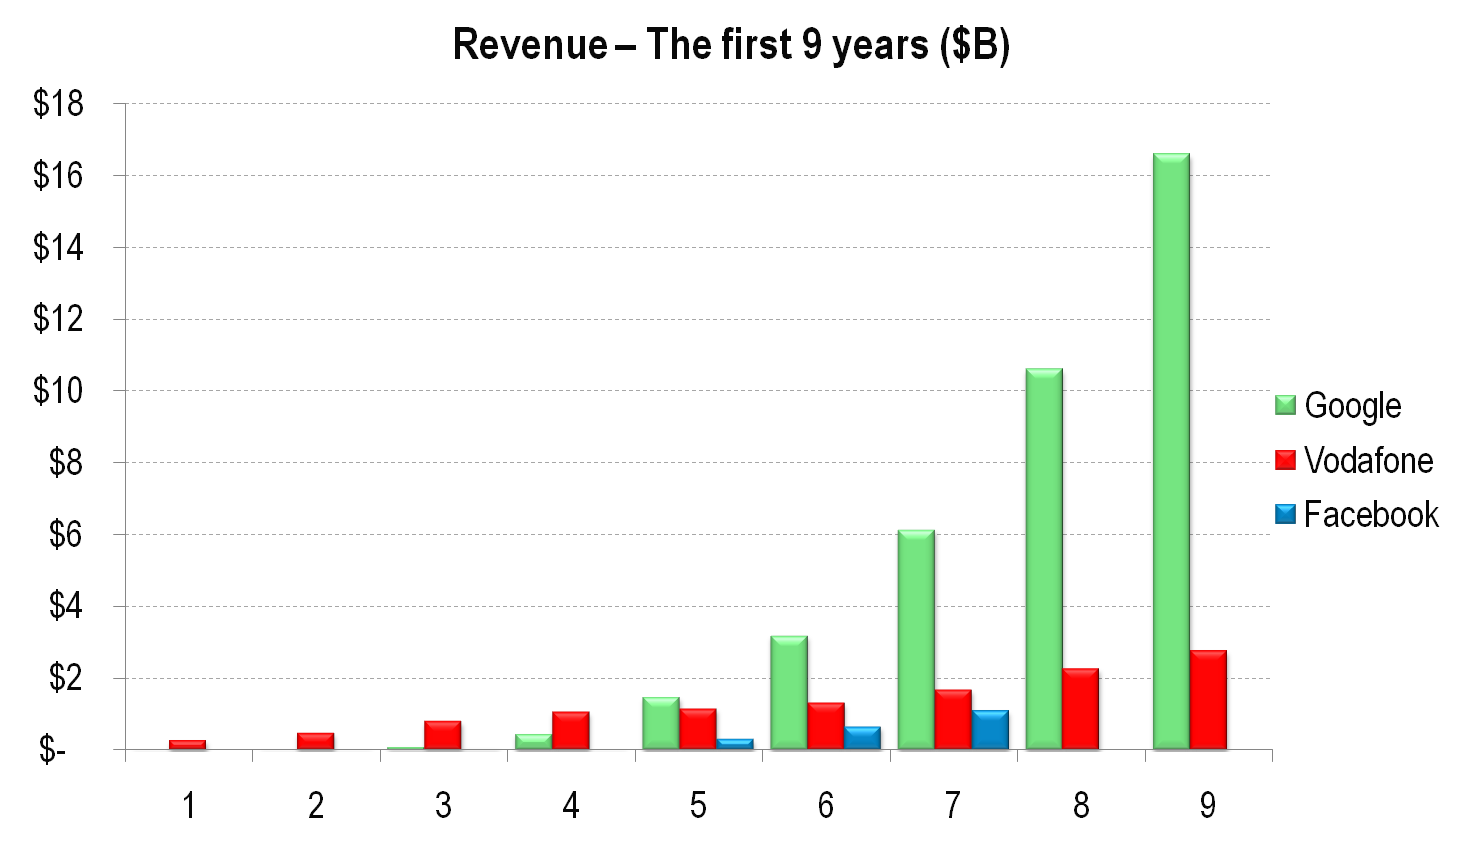
The Facebook IPO filing allows a comparison with two companies who built great businesses built upon networks: Search (as represented by Google) and Mobile (as represented by Vodafone)
Figure 1: Three major tech companies, the first nine years

Source: STL Partners analysis of company records
Vodafone and Facebook show similar revenue growth over the first nine years. However, Google stands out because it is all about discovery, and for advertisers, generates potential leads. As we’ve said before, this is a huge challenge for Facebook moving forward: how can it move beyond brand advertising to lead generation, or failing that, getting users to pay for services via Facebook Credits.
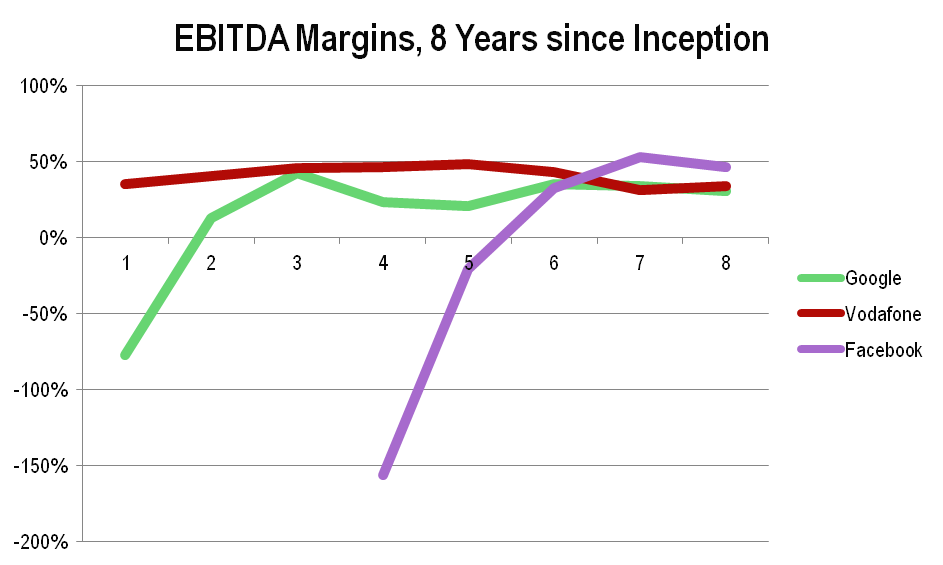
Figure 2: A Dash to 45+% Margins

Source: STL Partners analysis of company records
Facebook has the highest profit (EBITDA) margin at this stage of development even though, as advertising-funded businesses, both Facebook and Google suffered early start-up losses while building the audience and attention that appeal to advertisers.
However, when we examine the current state in terms of absolute revenues, cash and profits, Facebook is far behind both Vodafone and Google in absolute numbers, and requires huge ongoing growth to deserve anywhere near the valuation of $100bn quoted in some quarters.
Figure 3: Comparisons: Facebook, Google, Vodafone
|
2011 Results |
|
|
Vodafone (*) |
|
Revenue |
$1.55bn |
$37.9bn |
$72.6bn |
|
Free Cash Flow |
$0.470bn |
$11.1bn |
$11.1bn |
|
Enterprise Value (Market Capitalisation plus/(minus) Net Debt/(Cash) |
$100bn (#) |
$153bn |
$181bn |
*Vodafone figures are for the year 2010/11 (ending Mar-2011) and converted to $'s using cable rate of 1.58.
#The IPO price of Facebook has not yet been fixed, but the press seem focussed upon a $100bn valuation
To read the note in full, including the following analysis...
...Members of the Telco 2.0 Executive Briefing Subscription Service and the Telco 2.0 Dealing with Disruption Stream can download the full 23 page report in PDF format here. Non-Members, please subscribe here, buy a Single User license for this report online here for £595 (+VAT for UK buyers), or for multi-user licenses or other enquiries, please email / call +44 (0) 207 247 5003.
Organisations, geographies, people and products referenced: 0.facebook.com, Amazon, Amazon Web Services (AWS), AOL, Apple, Arete, Asia, Bebo, China, Comscore, Deezer, Deutsche Telekom, Europe, Facebook, Facebook Credits, Friends Reunited, Google, Google +, Google Buzz, ITV, Japan, Korea, LiveJournal, Microsoft, MySpace, Netflix, newsfeeds, North America, Opera, Orkut, Pandora, Richard Kramer, RIM, Skype, Sponsored Stories, Spotify, Twitter, UK, US Securities Exchange Commission (SEC), USA Vodafone, WhatsApp, Yahoo!, YouTube, Zynga.
Technologies and industry terms referenced: Advertising, ARPU, Bass diffusion model, EBITDA, Facebook fatigue, gaming, Initial Public Offering (IPO), Mobile, monthly active users (MAU), music, platform, Privacy, S-1, Search, Social Networks, valuation, video.